IHateMLClassification
I hate machine learning classification, so I use Hypothesis testing for classifying MNIST data.
Introduction
As the name suggests, I hate the overrate of the use of machine learning to classifying MNIST data. Like, why do we need to use those fancy algorithm for this simple task? So, I propose to use the more traditional way that can be taught to first year student who are taking basic statistics. Introducing hypothesis testing classification algorithm.
Side/technical note
This is just a metric learning. Here, we use Hotelling’s $T^2$ statistic to perform a $F$-test whether the mean difference between the new observation $x$ and known data $X_c$ is significant or not. If it is significant, then $x$ probably not in class $c$. We iterate all until we run out of class to iterate and we done. More technical detail would be
Statistical Modelling
- Compute Class Statistics:
- For each digit class $c$, calculate the mean vector $\mu_c$ and the precision matrix $S_c^{-1}$.
- Hotelling’s $T^2$ Test:
- For a given test observation $x$, compute the Hotelling’s $T^2$ statistic for each class: \(T^2_c = (x - \mu_c)^\top S_c^{-1} (x - \mu_c)\)
- Convert the $T^2$ statistic to an $F$-value: \(F_c = \frac{n - p}{p \times n} \times T^2_c\) where $n$ is the number of samples in class $c$ and $p$ is the dimensionality of the data.
- Derive the $p$-value for this $F$-value using the CDF of the $F$-distribution. Which is essentially, \(p_{\text{val}}(F_c) = 1 - \left[ \frac{\Gamma\left(\frac{1}{2}\right)}{\Gamma\left(\frac{p}{2}\right) \Gamma\left(\frac{1-p}{2}\right)} \int_{0}^{\frac{pF_c}{pF_c + (1-p)}} t^{\frac{p}{2}-1} (1-t)^{\frac{1-p}{2}-1} dt \right]\)
Classification Decision
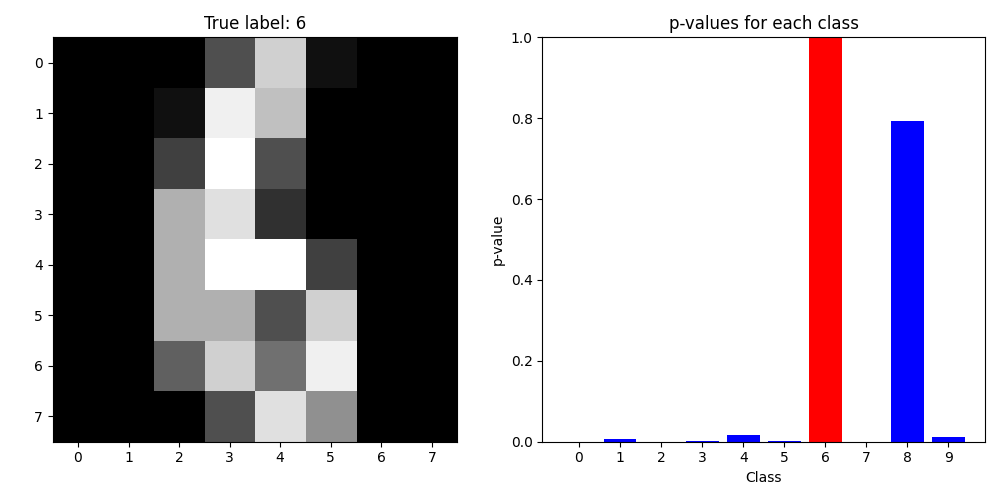
- Assign the test observation $x$ to the class $c^*$ with the highest $p$-value:
- If all $p$-values are below a significance threshold (e.g., $0.05$), classify $x$ as “unknown”.
Result
We got accuracy of 90.43% on 50% test data. Here is the visualization of what we got.
Here is also the test results for the others dataset
| Dataset | Accuracy | class |
|---|---|---|
| Fashion | 51.22% | 10 |
| Iris | 93.33% | 3 |
| Wisconsin | 76.14% | 2 |
Why no one do this?
Ok, I will let you evaluate time complexity of the said algorithm as your homework.
Expansion and Todo
First and foremost, we need to focus on the theoretical justification on this method. At this point, this is a one-observation and one-sample test. We can’t do much with one-observation test as we can’t infers its distribution or its properties.
Also, the test statistic is a metric in a sense. Another approach that is relatively well-explored is to use the kernel method[1,2] where the whole goal is to find a difference between mean function value from two distributions. We can try that or go on the tangent line and try to find the non-metric version of the test statistic.
Idea that I have right now is to turn the decision tree into a series of hypothesis tests and use that as a non-metric alternative. Note that there is a need for non-metric test statistic as to classify things in a non-metric space, we need a non-metric test statistic. However, the behavior of the test in that space is needed to be explored.
Another idea is to turn the naive bayes into bayesian test. That is more staightforward. However, that should be well explored.
Note
At this point of the work, it is just essentially try to find \(c_{x_0} = \arg\min_{\mu_c\in\boldsymbol{\mu}} (x_0 - \mu_c)^\top S_c^{-1}(x_0 - \mu_c)\) i.e., minimum Mahalanobis distance (in a sense). Other test statistic needed to be explored to make this a real work.
Code
Code can be access here
References
[1] A. Gretton, K. M. Borgwardt, M. J. Rasch, B. Schölkopf, and A. Smola, ‘A Kernel Two-Sample Test’, Journal of Machine Learning Research, vol. 13, no. 25, pp. 723–773, 2012.
[2] A. Schrab, I. Kim, M. Albert, B. Laurent, B. Guedj, and A. Gretton, ‘MMD Aggregated Two-Sample Test’, Journal of Machine Learning Research, vol. 24, no. 194, pp. 1–81, 2023.